
Dynamic QR code analytics can show when people scanned, what kind of device they used, where the scan likely came from, and which printed placement pulled its weight. That makes them useful for judging a poster, table card, mailer, or package without guessing. If you need scan counts by hour, geography, referrer, and device, you need a dynamic code, not a static one.
Static codes can open a link forever, but they cannot tell you much after the scan. Dynamic ones route through a short link first, which is how scan tracking and reports work at all. On QRFLOW.codes, full scan analytics are a paid feature, so this is mainly a question for teams deciding whether the data is worth it.
What do dynamic QR code analytics actually show?#

Dynamic QR code analytics usually show five useful things: total scans, rough location, device type, referrer, and time of scan. The exact mix depends on the tool, but those are the signals most marketers and analysts use first.
Total scans are the headline number, but they are rarely enough on their own. A code scanned 300 times could be great on a niche trade show handout and weak on a store window seen by thousands.
Rough location is usually city or region level, not a person's exact GPS dot. That is enough to spot useful patterns, like a campaign that overperformed in one metro area or a tourist-heavy location getting scans from many countries.
Device data usually means phone type, operating system, or desktop versus mobile. If 92 percent of scans come from phones, the page behind the code should load fast, fit a small screen, and put the main action near the top.
Referrer data shows where the scan came from when that information is available. For example, you may be able to separate scans from a social app browser versus a camera app, which helps explain why some visits bounce faster.
Time-based analytics are often the sleeper hit. Hour-of-day and day-of-week trends can tell you when a table tent, poster, or product insert gets attention, which is genuinely useful for staffing, ad timing, and offer windows.
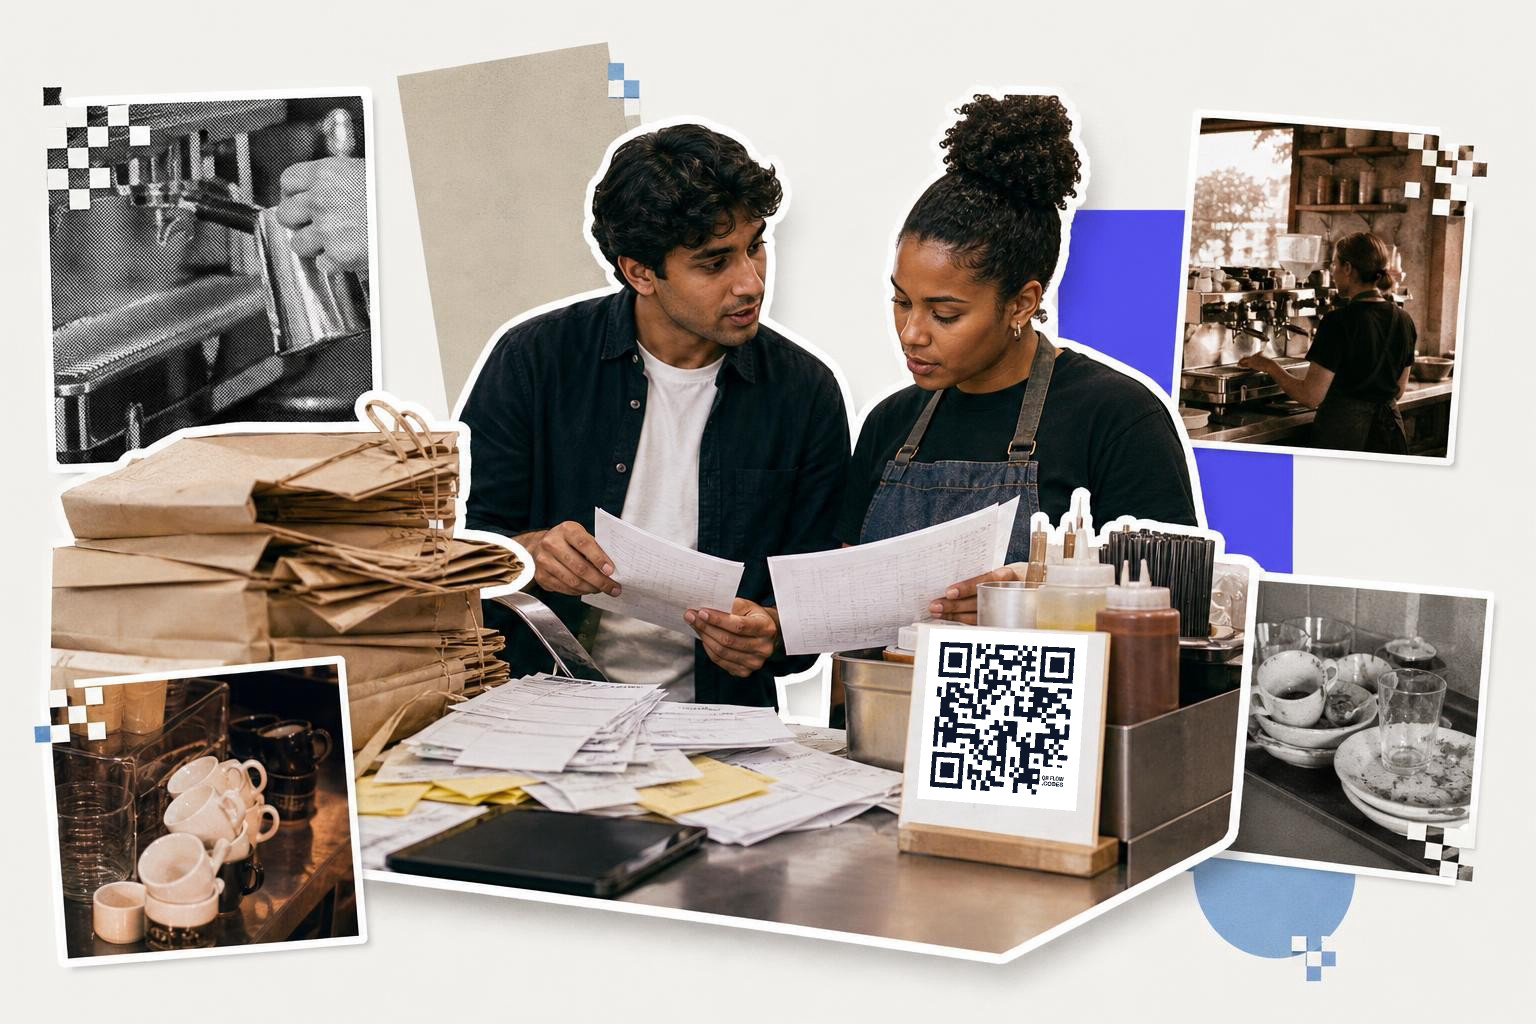
A practical example: if a cafe prints one code on the front door and another on takeout bags, dynamic QR reports can show which placement drives morning scans and which one wins after 6 p.m. That is better than treating all scans as one bucket.
Need a code you can edit and then measure after print? The free QR code generator is the place to make one, and your first dynamic code is free.
How accurate is location tracking from a QR scan?#
Location tracking from a QR scan is usually approximate, not exact. It is good for city, region, and country patterns, but not for proving that one person stood in one exact aisle.
Most dynamic code platforms infer location from IP data or similar network signals. That works well enough for campaign decisions, but it has limits. A mobile carrier can place a scan in the next city over, and a VPN can make the result look like another state or country.
That means location tracking is strongest when you use it in groups. Fifty scans from downtown tells you more than one odd scan from three states away.
For local businesses, the useful question is not "Where was each person standing?" It is "Did this neighborhood mailer bring scans from the area we paid to reach?"
For multi-location brands, geography becomes a comparison tool. If two stores use the same poster but one gets three times the scans, the difference may be the offer, the foot traffic, or the placement height, not the code itself.
If geography matters in your reporting, pair the scan data with page analytics and campaign naming. A code named by store, table, shelf, or mail drop tells a cleaner story than one generic code reused everywhere. If you want a deeper look at the limits, read Understanding QR code location tracking.
Which metrics matter for QR code ROI?#

QR code ROI comes from matching each code to one business outcome. The right metric is not always total scans, and often it is not even the most useful one.
For a restaurant menu code, success may mean scans per table or scans during peak hours. For a product insert, it may mean repeat scans over 30 days. For a flyer, it may mean scans that reached a coupon page and then led to redemptions.
Here are the metrics worth watching first:
- Scans by placement, such as poster versus counter card
- Scans by hour or day, to spot timing patterns
- Device split, to catch weak mobile pages
- Geography, if the campaign is local or regional
- Downstream conversions on the page behind the code
The catch is simple: a scan is interest, not revenue. To measure QR code ROI, you need the scan data plus one next-step signal, like purchases, bookings, form submits, or coupon uses.
This is where dynamic codes earn their keep. If one print run underperforms, you can change the destination after printing instead of tossing 500 cards. A plain static vs dynamic QR code comparison helps if you are still choosing the type.
Some teams also need to share results outside the dashboard. Full dynamic QR reports with CSV export are useful when your analyst wants to join scan data with campaign spend, store sales, or event attendance.
If you are trying to set up that measurement properly, How to track QR code scans effectively covers the reporting basics.
How should you use scan data to change a campaign?#
Dynamic QR code analytics are most useful when they lead to one clear change. Good scan tracking should tell you what to move, swap, rewrite, or stop printing.
Start with placement. If the same offer on a receipt gets 4 times the scans of the in-store poster, print more receipts with the code and stop treating the poster as the hero.
Next, check timing. If scans spike from 11 a.m. to 1 p.m., run the lunch offer then, not all day. If evening scans come mostly from package inserts, tailor that landing page to repeat buyers instead of first-time visitors.
Then check device usage insights. A landing page that looks fine on a laptop can feel slow and cramped on a phone. If mobile dominates, trim the page, shorten the form, and put the button above the fold.
Finally, compare codes by job. One code should usually have one purpose. A review request, a menu, and a coupon should not all fight for space behind the same square.
If you manage lots of campaigns, naming matters almost as much as the scans. Use labels like spring-mailer-east, table-12-dessert, or box-insert-may so the reports mean something six weeks later.
Two limits are worth saying out loud. Dynamic reports can tell you about scan behavior, but not why a person chose not to buy. And they can point to a weak placement, but they cannot fix a boring offer.
Dynamic QR code analytics are great at showing what happened between print and visit. Use that view to improve the next decision, not to pretend the code alone caused every sale.
Understanding device type insights#
Dynamic QR code analytics often reveal the type of device used for scans. This data can show whether users are scanning with smartphones, tablets, or desktop computers. Knowing the device type helps tailor the digital experience. If most scans come from mobile devices, ensure the landing page is mobile-friendly. This means fast load times, easy navigation, and content that fits smaller screens.
Consider these points when analyzing device data:
- Mobile vs. Desktop: A high percentage of mobile scans suggests optimizing for touch interfaces and quick actions.
- Operating Systems: Knowing whether users are on iOS or Android can inform app development or platform-specific promotions.
- Device Models: Popular device models can guide design choices, ensuring compatibility with screen sizes and resolutions.
By understanding device preferences, campaigns can be more effective, offering a smooth user experience that matches how people access the content.
Using referrer data for insights#
Referrer data in dynamic QR code analytics shows where scans originate. This information can reveal if users come from social media apps, email clients, or web browsers. Understanding referrer sources helps refine marketing strategies and allocate resources effectively.
Here’s how to use referrer data:
- Identify Top Sources: Determine which platforms drive the most scans.
- Understand User Behavior: If scans frequently come from social media, consider enhancing social media engagement or running targeted ads.
- Optimize Content: Tailor content to match the referrer source. For instance, if a scan comes from a camera app, ensure the landing page is visually appealing and quick to load.
Use referrer data to identify which app or browser drives more scans.
Analyzing time-based scan trends#
Time-based analytics in dynamic QR code reports provide insights into when scans occur.
Consider these aspects when analyzing time data:
- Peak Hours: Identify when scans peak. Align promotions or staffing during these times to capture maximum engagement.
- Day of the Week: Recognize which days see more activity. This can inform weekly planning, such as running special offers on high-traffic days.
- Seasonal Patterns: Look for trends over months or seasons. Adjust campaigns to capitalize on seasonal peaks or address off-peak periods.
By understanding when users are most active, businesses can optimize the timing of their campaigns, ensuring they reach audiences at the most opportune moments.
Questions people ask about dynamic QR code analytics#
How do dynamic QR codes differ from static ones?#
Dynamic QR codes can be updated after printing and provide scan analytics like location, device type, and time. Static QR codes link to a fixed URL and do not offer tracking data. Dynamic codes are more versatile for marketing and analysis.
Can dynamic QR codes track individual users?#
No, dynamic QR codes do not track individual users. They provide aggregate data like total scans, rough location, and device type. This data helps identify patterns and trends, but it does not pinpoint individual user behavior or identity.
What kind of businesses benefit most from dynamic QR code analytics?#
Businesses that rely on print marketing, like restaurants, retail stores, and event organizers, benefit from dynamic QR code analytics. These businesses can use scan data to optimize marketing strategies, adjust offers, and improve customer engagement based on real-time insights.
How can I improve my QR code scan rates?#
To improve scan rates, ensure your QR code is visible and accessible. Use a clear call-to-action, place it in high-traffic areas, and ensure the linked content is mobile-friendly. Regularly analyze scan data to refine placement, timing, and messaging for better results.
If you want editable links, scan reports, and exports in one place, see QRFLOW.codes or compare plans on /pricing.
For most teams, the win is simple: fewer guesses, fewer wasted reprints, and better choices about where a code goes next.